Risk & Behavior Analysis
The scientific evaluation of an algorithm extends beyond a simple measurement of returns
1. Introduction
In quantitative finance, the quality of an algorithm is not judged solely by the total profit it can produce. Equally important factors are the stability of results, the consistency of signals, adaptability across different market regimes, and effective investment-risk management.
The Momentum Volatility ST Indicator was developed to systematically identify high-quality trends by combining mathematical momentum, volatility, and statistical analysis. Its evaluation is based on extensive long-horizon historical backtests that examine not only profitability but also the overall behavior of the strategy under different market conditions.
The Heliophant philosophy is that a reliable algorithm must be characterized by consistency, repeatability, and disciplined risk management — not by outsized returns concentrated in isolated periods.
2. Bitcoin (BTC/USD)
Evaluation period
October 5, 2009 — July 17, 2026
The evaluation was performed on a historical sample longer than 16 years, covering all major bull and bear cycles of the Bitcoin market, periods of exceptionally high volatility, and a variety of macroeconomic environments. The length of the sample allows an objective assessment of the algorithm’s robustness and statistical reliability.
3. Key Performance Metrics
| Metric | Result |
|---|---|
| Annualized Return (CAGR) | 369.73% |
| Winning Trades | 66.7% |
| Total Trades | 69 |
| Average Trade Duration | 81 Days |
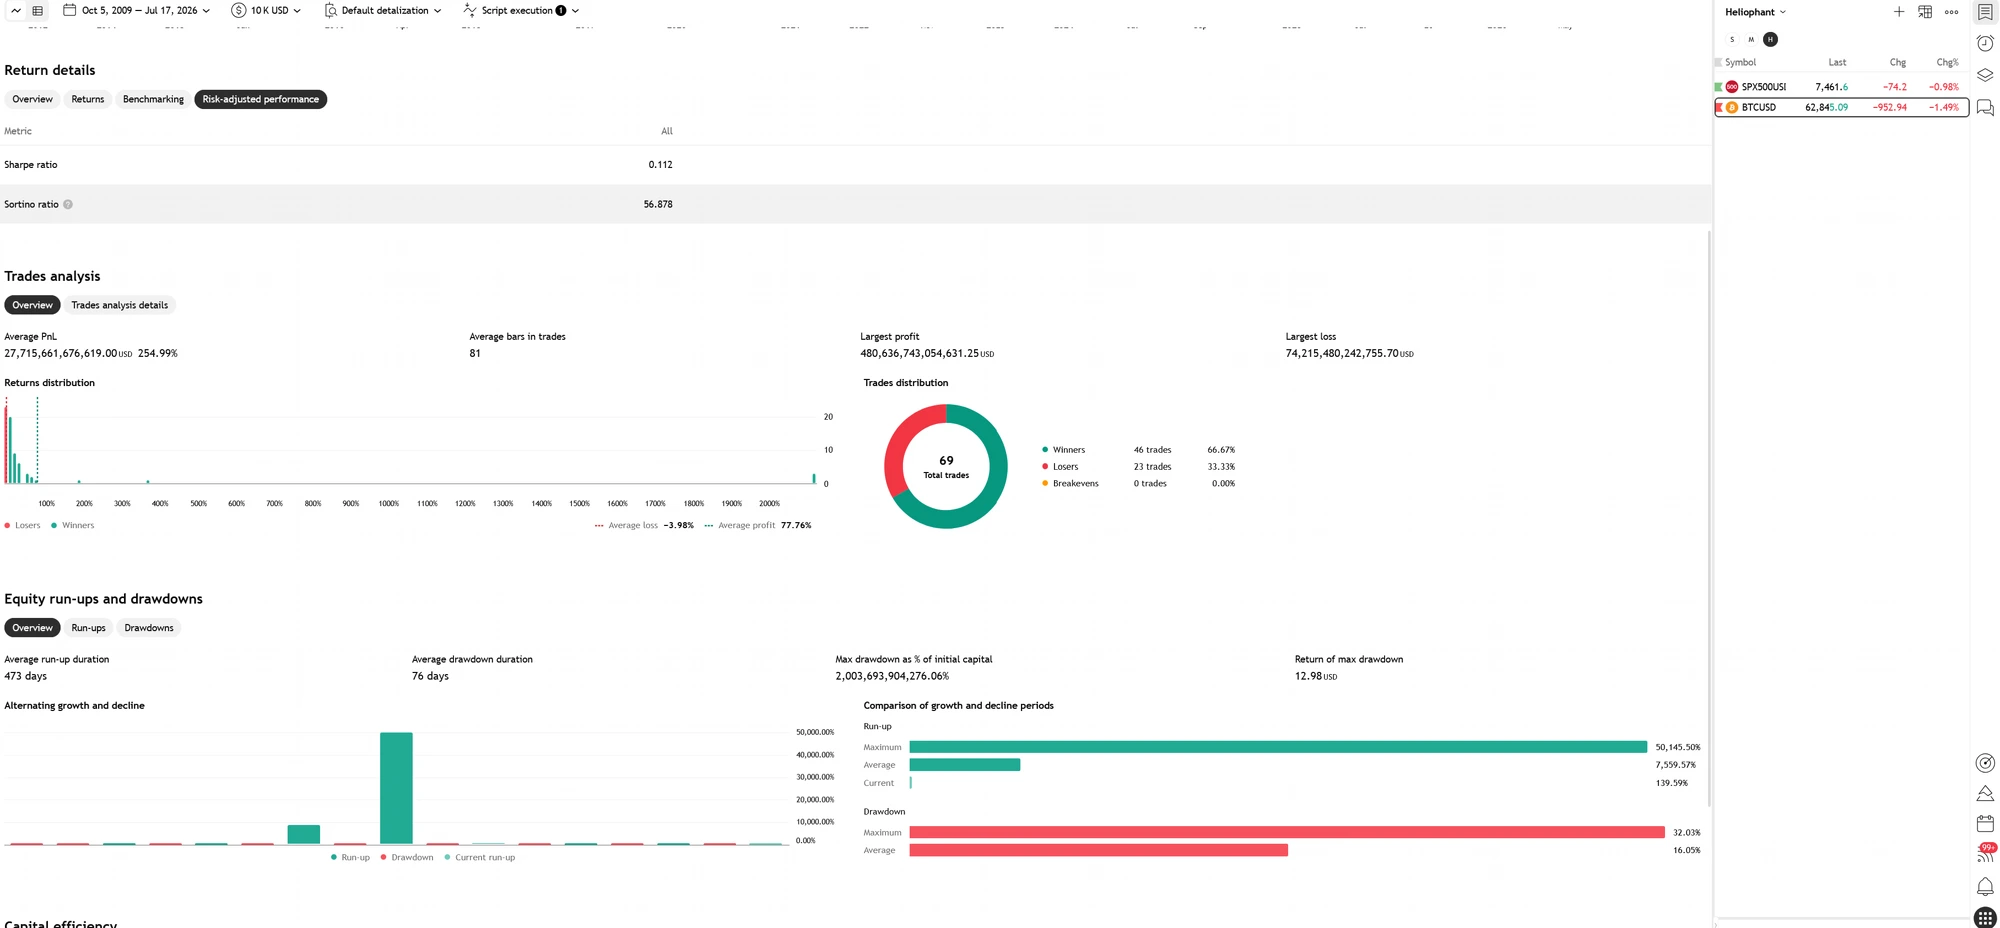
The images below correspond to a historical simulation with an initial capital of USD 10,000 and compound growth (compounding).

4. Interpretation of the results
The Compound Annual Growth Rate (CAGR) stands at 369.73%, expressing the theoretical average annual growth rate of capital over the tested period, taking compound growth into account. CAGR is one of the most widely recognized metrics for evaluating investment strategies because it enables comparable performance assessment regardless of the backtest length.
In parallel, the algorithm completed 69 total trades, of which 66.7% were profitable. This ratio indicates a strong ability to identify dominant market trends and to limit false signals.
The average trade duration of 81 days confirms that the strategy is not designed for frequent position turnover or short-term high-frequency trading. Instead, the Momentum Volatility ST Indicator is designed to identify and follow the significant medium- and long-term movements of the market, allowing strong trends to fully develop before a new signal is produced.
Annualized Return (CAGR)
369.73%
Winning Trades
66.7%
Total Trades
69
Average Trade Duration
81 Days
5. Scientific evaluation approach
The evaluation of the Momentum Volatility ST Indicator is based on objective quantitative criteria — not on isolated winning trades or short periods of high performance. The use of multi-year historical data, combined with statistical reliability and risk-management metrics, allows an assessment of the algorithm’s stability, consistency, and adaptability across different market regimes.
The Heliophant philosophy is that long-term success does not stem from predicting every individual market move, but from the systematic application of a disciplined and scientifically grounded methodology that seeks to optimize the relationship between return and assumed risk.
6. Note
The metrics presented above are derived from historical simulations (backtesting) and are used exclusively to evaluate the statistical behavior of the algorithm. Historical performance does not constitute a guarantee of comparable future results, as the behavior of financial markets is influenced by factors that change over time.
See the signals in real conditions
The Momentum Volatility ST Indicator is available to Basic Plan subscribers via TradingView.
Get access