Algorithms
Momentum Volatility ST Indicator — technical documentation
1. Introduction
The Momentum Volatility ST Indicator is a quantitative indicator combining directional momentum with price volatility to provide systematic quantitative signals on trend changes for selected financial instruments (S&P 500, BTC).
It is not a prediction tool. It seeks to improve the return-to-risk relationship through a consistent, objective methodology that filters part of the price noise.
2. Mathematical Momentum
Momentum is defined as the rate of price change over an n-period window:
Absolute momentum
M(t) = P(t) − P(t − n)
Relative momentum (%)
M_rel(t) = ( P(t) − P(t − n) ) ⁄ P(t − n) × 100%
Positive M(t) values indicate an uptrend; negative, a downtrend. The choice of n defines the horizon — larger n filter short-term noise.
3. Volatility
Volatility expresses the dispersion of prices around a central measure. It is used as a risk metric, not a return metric.
The indicator uses log-returns r_i = ln(P_i / P_{i-1}) as its base, so volatility remains scale-invariant and comparable across different asset classes.
4. Standard Deviation
Standard deviation σ of log-returns over an N-period window:
Sample standard deviation
σ = √( Σ (r_i − μ)² ⁄ (N − 1) )
Mean of returns
μ = ( Σ r_i ) ⁄ N
Annualized standard deviation is obtained by multiplying by √(periods per year) — 252 for daily equities / S&P 500 data, 365 for cryptocurrencies (24/7 markets).
5. Adaptive ST Logic
The ST (Systematic Threshold) component combines M(t) and σ into a composite signal with adaptive thresholds. The threshold is not a fixed number — it is dynamically recalibrated to reflect the current volatility regime of the underlying asset.
In practice, thresholds tighten in low-volatility regimes (more sensitive indicator) and widen in high-volatility regimes (noise filter). This adaptation filters part of the price noise and reduces the number of false signals.
6. Generated Signals
Despite the complex mathematical and statistical processes running in the background, the Momentum Volatility ST Indicator is designed to deliver a simple and immediately actionable user experience.
The algorithm dynamically combines momentum analysis, volatility, and the statistical dispersion of the market, transforming all of that information into a single, clear directional signal.
The user only needs to monitor two types of signals:
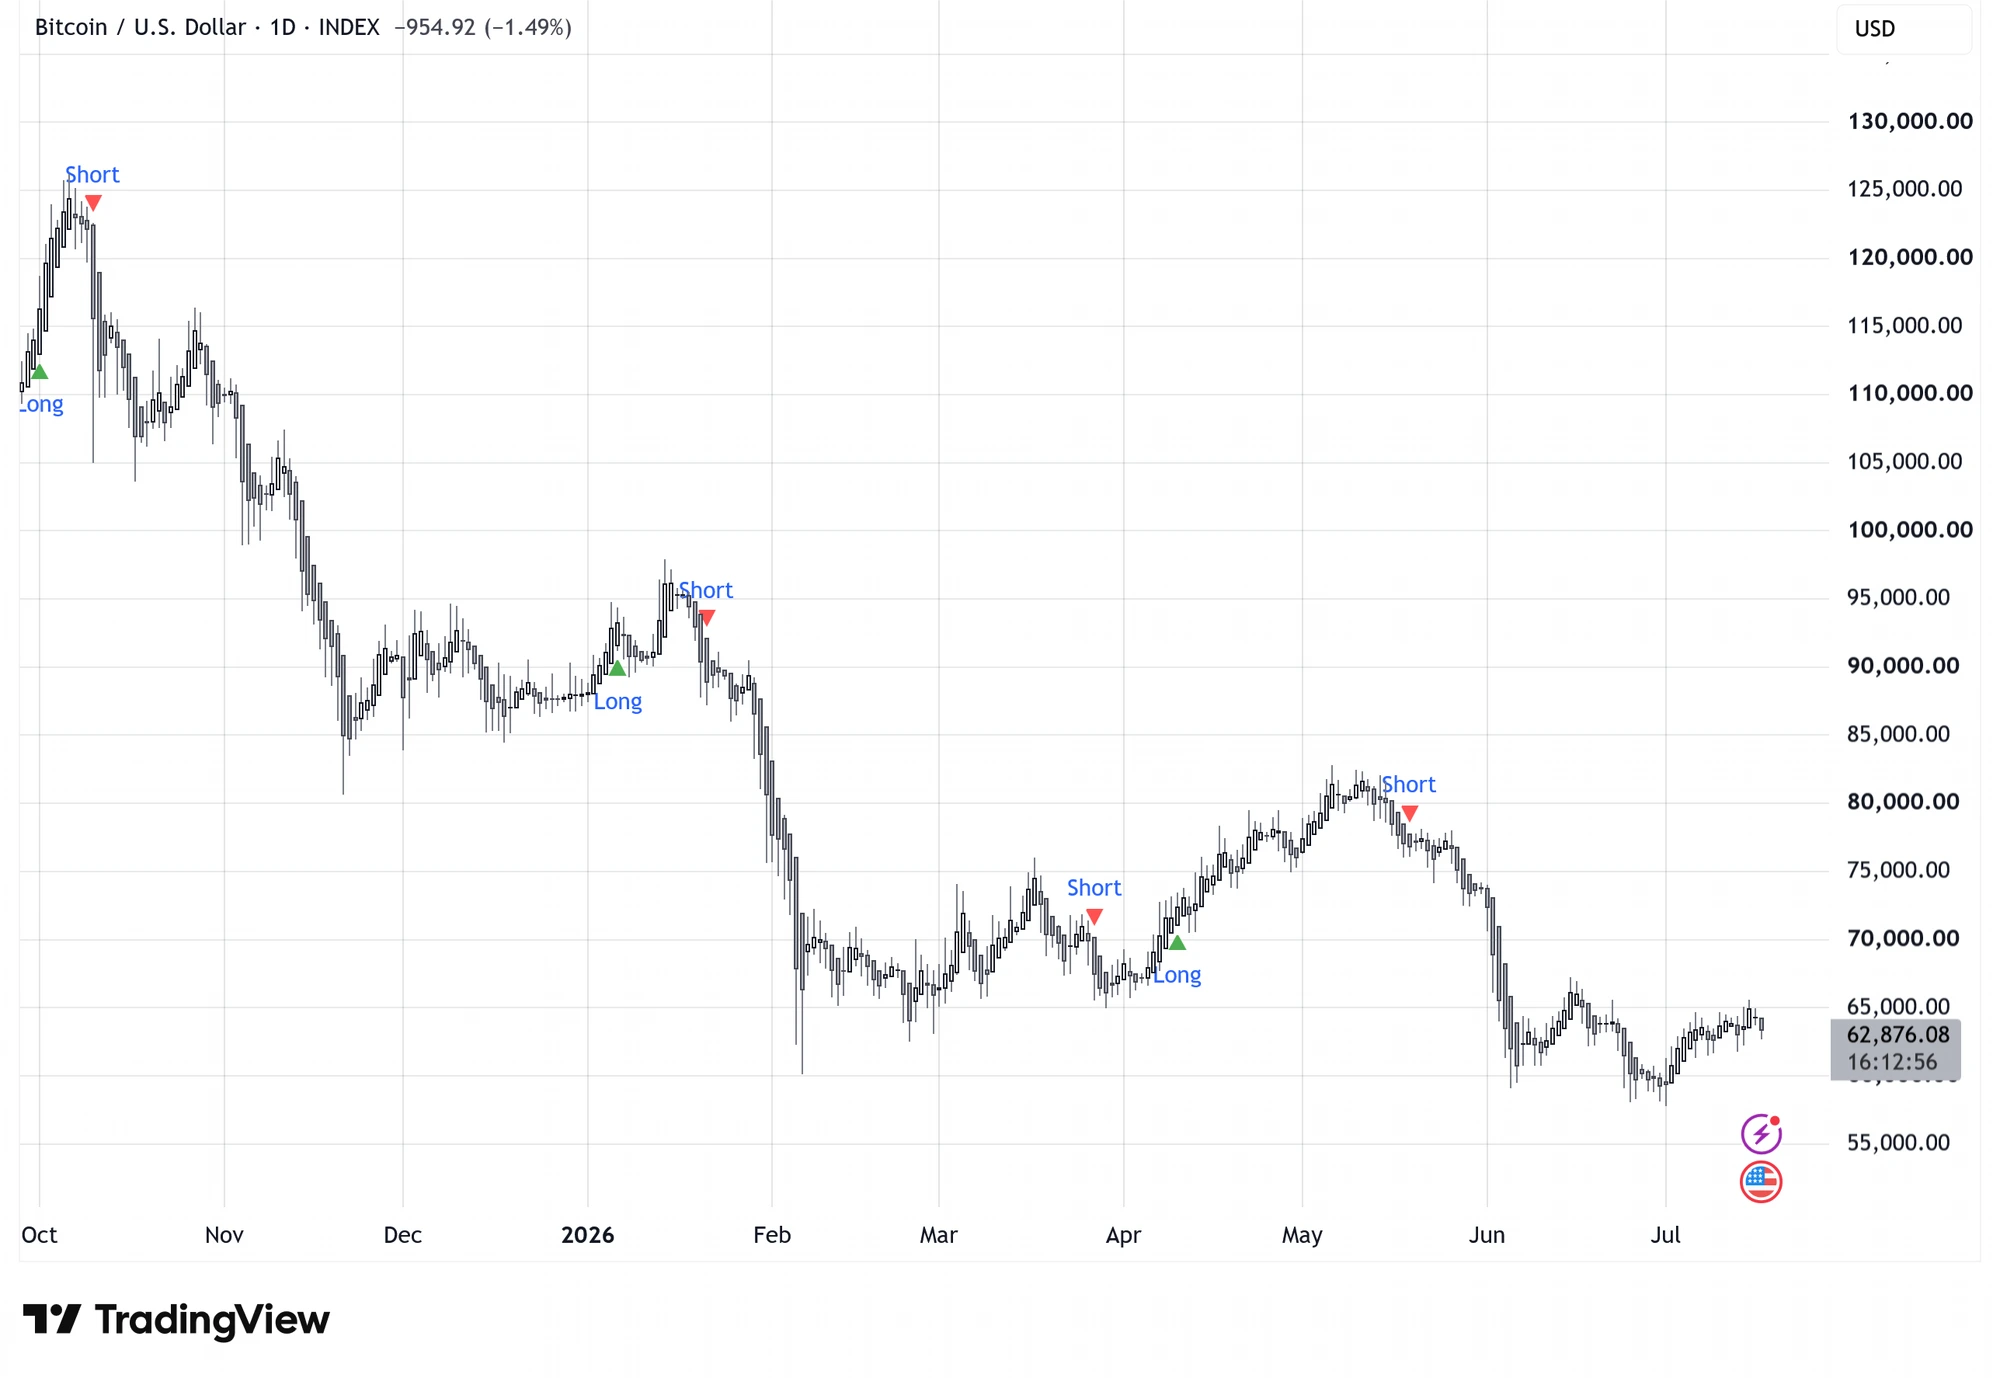
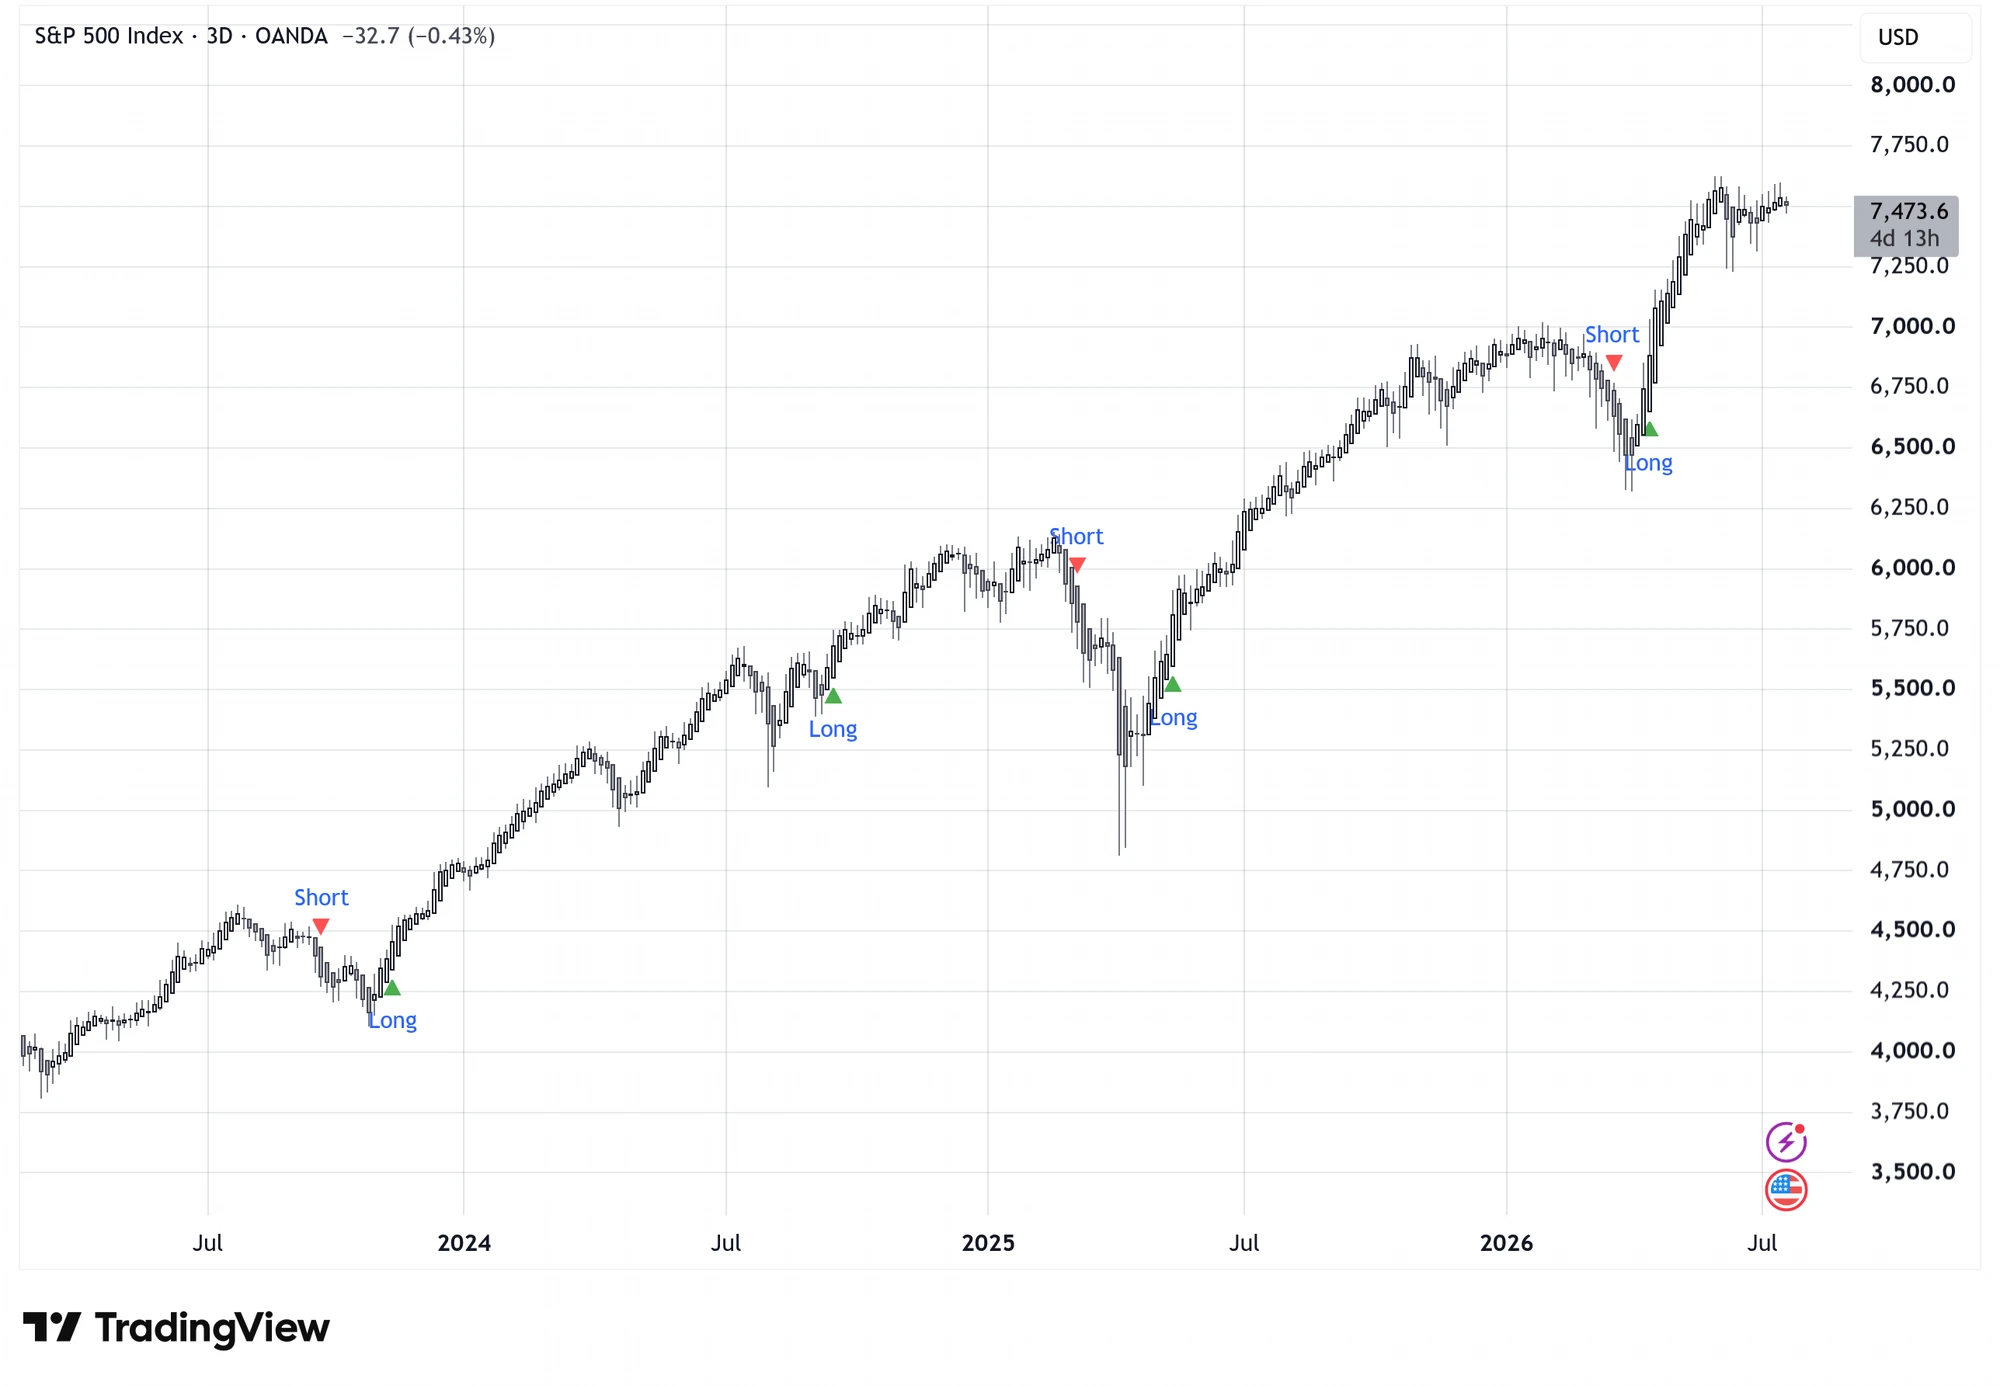
Long Signal — indicates that current market conditions favor holding or entering a long position.
Short Signal — indicates that current market conditions favor holding or entering a short position.
The user is not required to analyze complex mathematical calculations or interpret multiple technical indicators. All quantitative analysis is performed automatically by the algorithm, which presents only the final result as a clear Long or Short signal.
7. TradingView Access
The indicator is available as a closed-source Pine Script indicator on the TradingView platform. Subscribers receive access to their TradingView username within 24 hours of subscription activation.
The indicator operates on all timeframes (1m to 1W) but is optimized for the daily (1D) BTC/USD chart and the 3-day (3D) S&P 500 chart.
The indicator has been developed to run on Heikin-Ashi candlesticks. This transform smooths short-term price fluctuations, dampens part of the stochastic noise, and allows a cleaner assessment of the underlying direction and the strength of the trend.
8. Risk Management
The effective use of a quantitative algorithm does not depend solely on the quality of the signals it generates — it also depends on the disciplined application of Risk Management principles. Long-term statistical performance of a trading system requires disciplined capital allocation, controlled risk exposure, and consistent enforcement of position-management rules.
Within the Momentum Volatility ST Indicator methodology, historical testing and strategy evaluation have been conducted with conservative leverage parameters. For markets that follow a long-term uptrend structure — such as the S&P 500 — the strategy is designed exclusively for long positions with a maximum indicative leverage of 4×. For Bitcoin, given its significantly higher volatility, a maximum indicative leverage of 2× is used, aiming to preserve controlled risk exposure.
These parameters are part of the research methodology of the system and do not substitute for each investor's personal risk assessment. The performance of any strategy is influenced by factors such as market volatility, liquidity, transaction costs, slippage, and the consistency with which capital-management rules are applied.
Get access to the indicator
The Momentum Volatility ST Indicator is available to Basic Plan subscribers via TradingView.
Get TradingView access